
Association Mining Rules Combined With Clustering
Introduction
In this blog I will guide you step by step on how to apply Apriori algorithm in R and then use the result to apply K-Means clustering on them. We will do this to see the diversity in rules created by the Apriori Algorithm so that we can have a clear understanding about them.
What is Association Rule
Association Rule Learning (also called Association Rule Mining) is a common technique used to find associations between many variables. It is often used by grocery stores, retailers, and anyone with a large transactional databases.
Since most transactions data is large, the apriori algorithm makes it easier to find these patterns or rules quickly.
So, What is a rule?
A rule is a notation that represents which item/s is frequently bought with what item/s. It has an LHS and an RHS part and can be represented as follows:
itemset A => itemset B
This means, the item/s on the right were frequently purchased along with items on the left.
If you want to learn more about the working of apriori algorithm then click here.
Okay, now lets start implementing the algorithm in R
Data set Selection
The data set that I have used is Groceries data set, taken from github.com. It contains one column and 700 observations. The reason to choose this data set is because it is specifically designed for association rules problem. There will be no need for us to modify the data. It is good to go for our algorithm.
You can download the data set from here.
Step 1 - Data Modeling and Preprocessing
First and the most obvious step is to load the data set.
![]()
Since the data set is pretty much simple and we don’t need to modify it but we still have to convert it into transactions so that our apriori algorithm can read it easily. In order to that what we need to do first is to install the ‘arules’ library.
![]()
After installing this library now we have to load the data set as transactions.
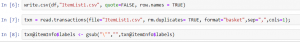
Step 2 - Applying Apriori Algorithm
Now our data is ready and good to go for the apriori algorithm. We will use the apriori function from the arules library.
![]()
The algorithm takes parameters such as minimum support and minimum confidence. After running this algorithm we will get an output like this.
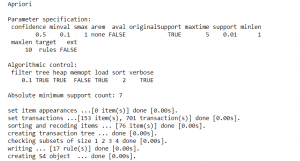
Now we have successfully run our apriori algorithm. To view the rules generated by the apriori algorithm we need to convert the rules into data frame.
![]()
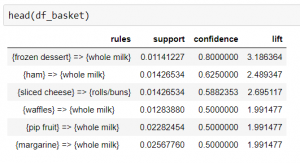
In the next step we will discuss how to visualize these rules.
Step 3 - Visualizing Apriori Algorithm
So we converted our data set into transactions and applied apriori algorithm on it. Now in order to better understand the association between our rules we can use a graph to highlight the support and lifts of various items in our repository but mostly to see which product is associated with which one in the sales environment.
We need to install arulesViz package first. This package contains all the visualizations you need for the association rules. This package contains a lot of visualizations, but I am just going to show you a few.
The first is the network graph
![]()
The size of graph nodes is based on support levels and the colour on lift ratios. The incoming lines show the Antecedants or the LHS and the RHS is represented by names of items.
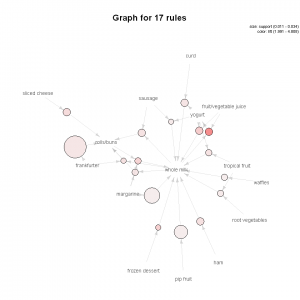
The above graph shows us that most of our transactions were consolidated around “Whole Milk”.
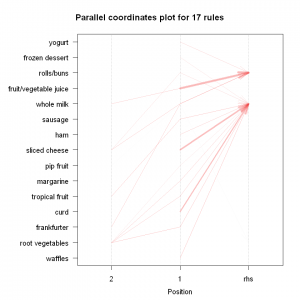
The next plot offers us a parallel coordinate system of visualisation. It would help us clearly see that which products along with which ones, result in what kinds of sales.
![]()
Next is the item frequency graph (histogram). Histograms depict how many times an item has occurred in our data set as compared to the others.
![]()
The relative frequency plot accounts for the fact that “Whole Milk” and “rolls and buns” constitute around half of the transaction dataset; half the sales of the store are of these items.
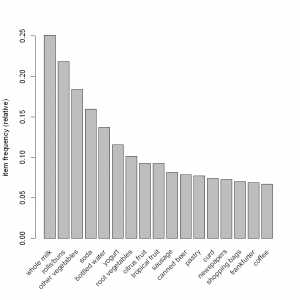
This would mean that a lot of people are buying milk and rolls/buns!
Step 4 - Applying K-mean clustering on Apriori Algorithm
Okay, now our apriori algorithm is complete and we can see the associations from the visualizations we made. now it’s time to use the results of the apriori algorithm and perform K-Mean clustering on them. If you want to know the basics of K-Means then click here.
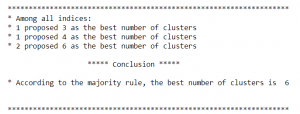
The first thing that we need to determine is that how many clusters we have to make. In order to do this we can see the changes in optimal K along with the number of criteria.
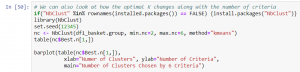
This will in result give the most optimal number of clusters that can be formed.
Now we will visualize our data by making a scatter plot. We are making this plot because later we will compare it with the scatter plot after the clustering has been applied.
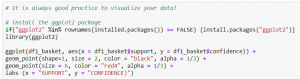
Darkness of the colour shows the lift.
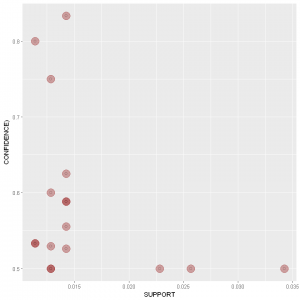
Now we will apply the k-mean clustering. The parameters for k-mean clustering that I have used are support, confidence and lift.
![]()
This will run the k-mean clustering on the rules that were generated by the apriori algorithm.
We will need to add the cluster numbers to our data frame and then view it.
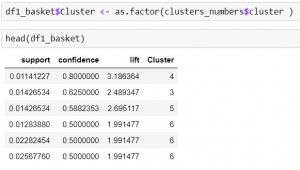
So now we have the clusters, but still we can’t see the rules that which rule corresponds to which cluster. We will do it later.
For now lets make the scatter plot and see the clusters that are formed.
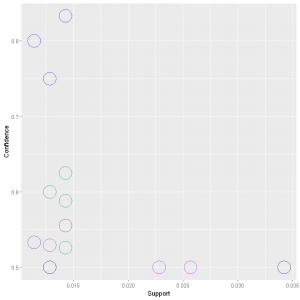
In the above graph we can see that the clusters are differentiated by the colours.
Now we will add the rules to cluster and finally view the rules corresponding to the clusters.
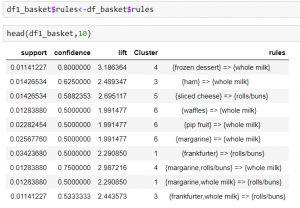
Just for better visualization I have arranged the clusters in ascending order.
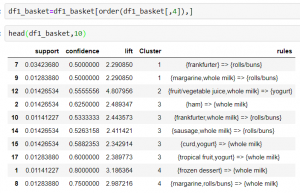
From the above table we can see that now the rules have been distributed in clusters. The first column shows the index number of the rules. You can see that rule number 7 and 9 belong to cluster number 1 and rule 1 and 8 belong to cluster number 4 and so on.
Gist of what we have learnt
So in this blog we first selected the data set, modified it a bit to make it ready for the algorithm. Then we applied the apriori algorithm and saw the results in a data frame. To beautify and better understand the results we performed some visualization on the rules. In the last step we executed the K-Mean Algorithm on the rules that were generated by the apriori algorithm. We performed some visualization to see our clusters and finally we organised the clusters in the data frame.